We introduced several new features for visualization of temperature fields.
Posted 2022-04-05
Categories:
New feature
, Plots
, Tips and tricks
The calculation of the approximated temperature fields (ATF) plots for buried cables has been a feature in Cableizer from the very beginning when the software was released in 2015. The output has always been a plot in 2D showing a colormesh with isolines of the temperature isolines calculated at any point around the cable installation. The calculation had to be done after the ampacity calculation with the given heat losses, soil thermal resistivity and ambient soil temperature. No additional settings were possible at first.
In 2018, we introduced the possiblity to set a specific isoline and highlight this in the plot. The same feature is used for calculations where drying-out of soil is considered and where the isoline at the critical temperature is highlighted in the plot. In 2019, we introduced the possibility to change the thermal resistivity before creating the plot and let the user change the min and max temperature of the plot. In 2020, we introduced an improved method to consider backfills which lead also to an update of the ATF. For the first time, the influence of non-homogenous soil layers was simulated. This is described in detail in another post. With introduction of the subsea module, the ATF was also implemented there including a feature helping with consideration of the 2K criterion. Finally, in 2020/2021, we introduced the ATF also for tunnel, which showed accepable results for deeply buried rectangular tunnels and good results for round tunnels when considering point-source correction.
With the new version from March 2022, many new features for visualization of approximated temperature fields (ATF) have been introduced which do increase the usability and improve the user experience.
| ATF with colormap rainbow | ATF with colormap coolwarm | ATF with colored isolines |
|---|---|---|
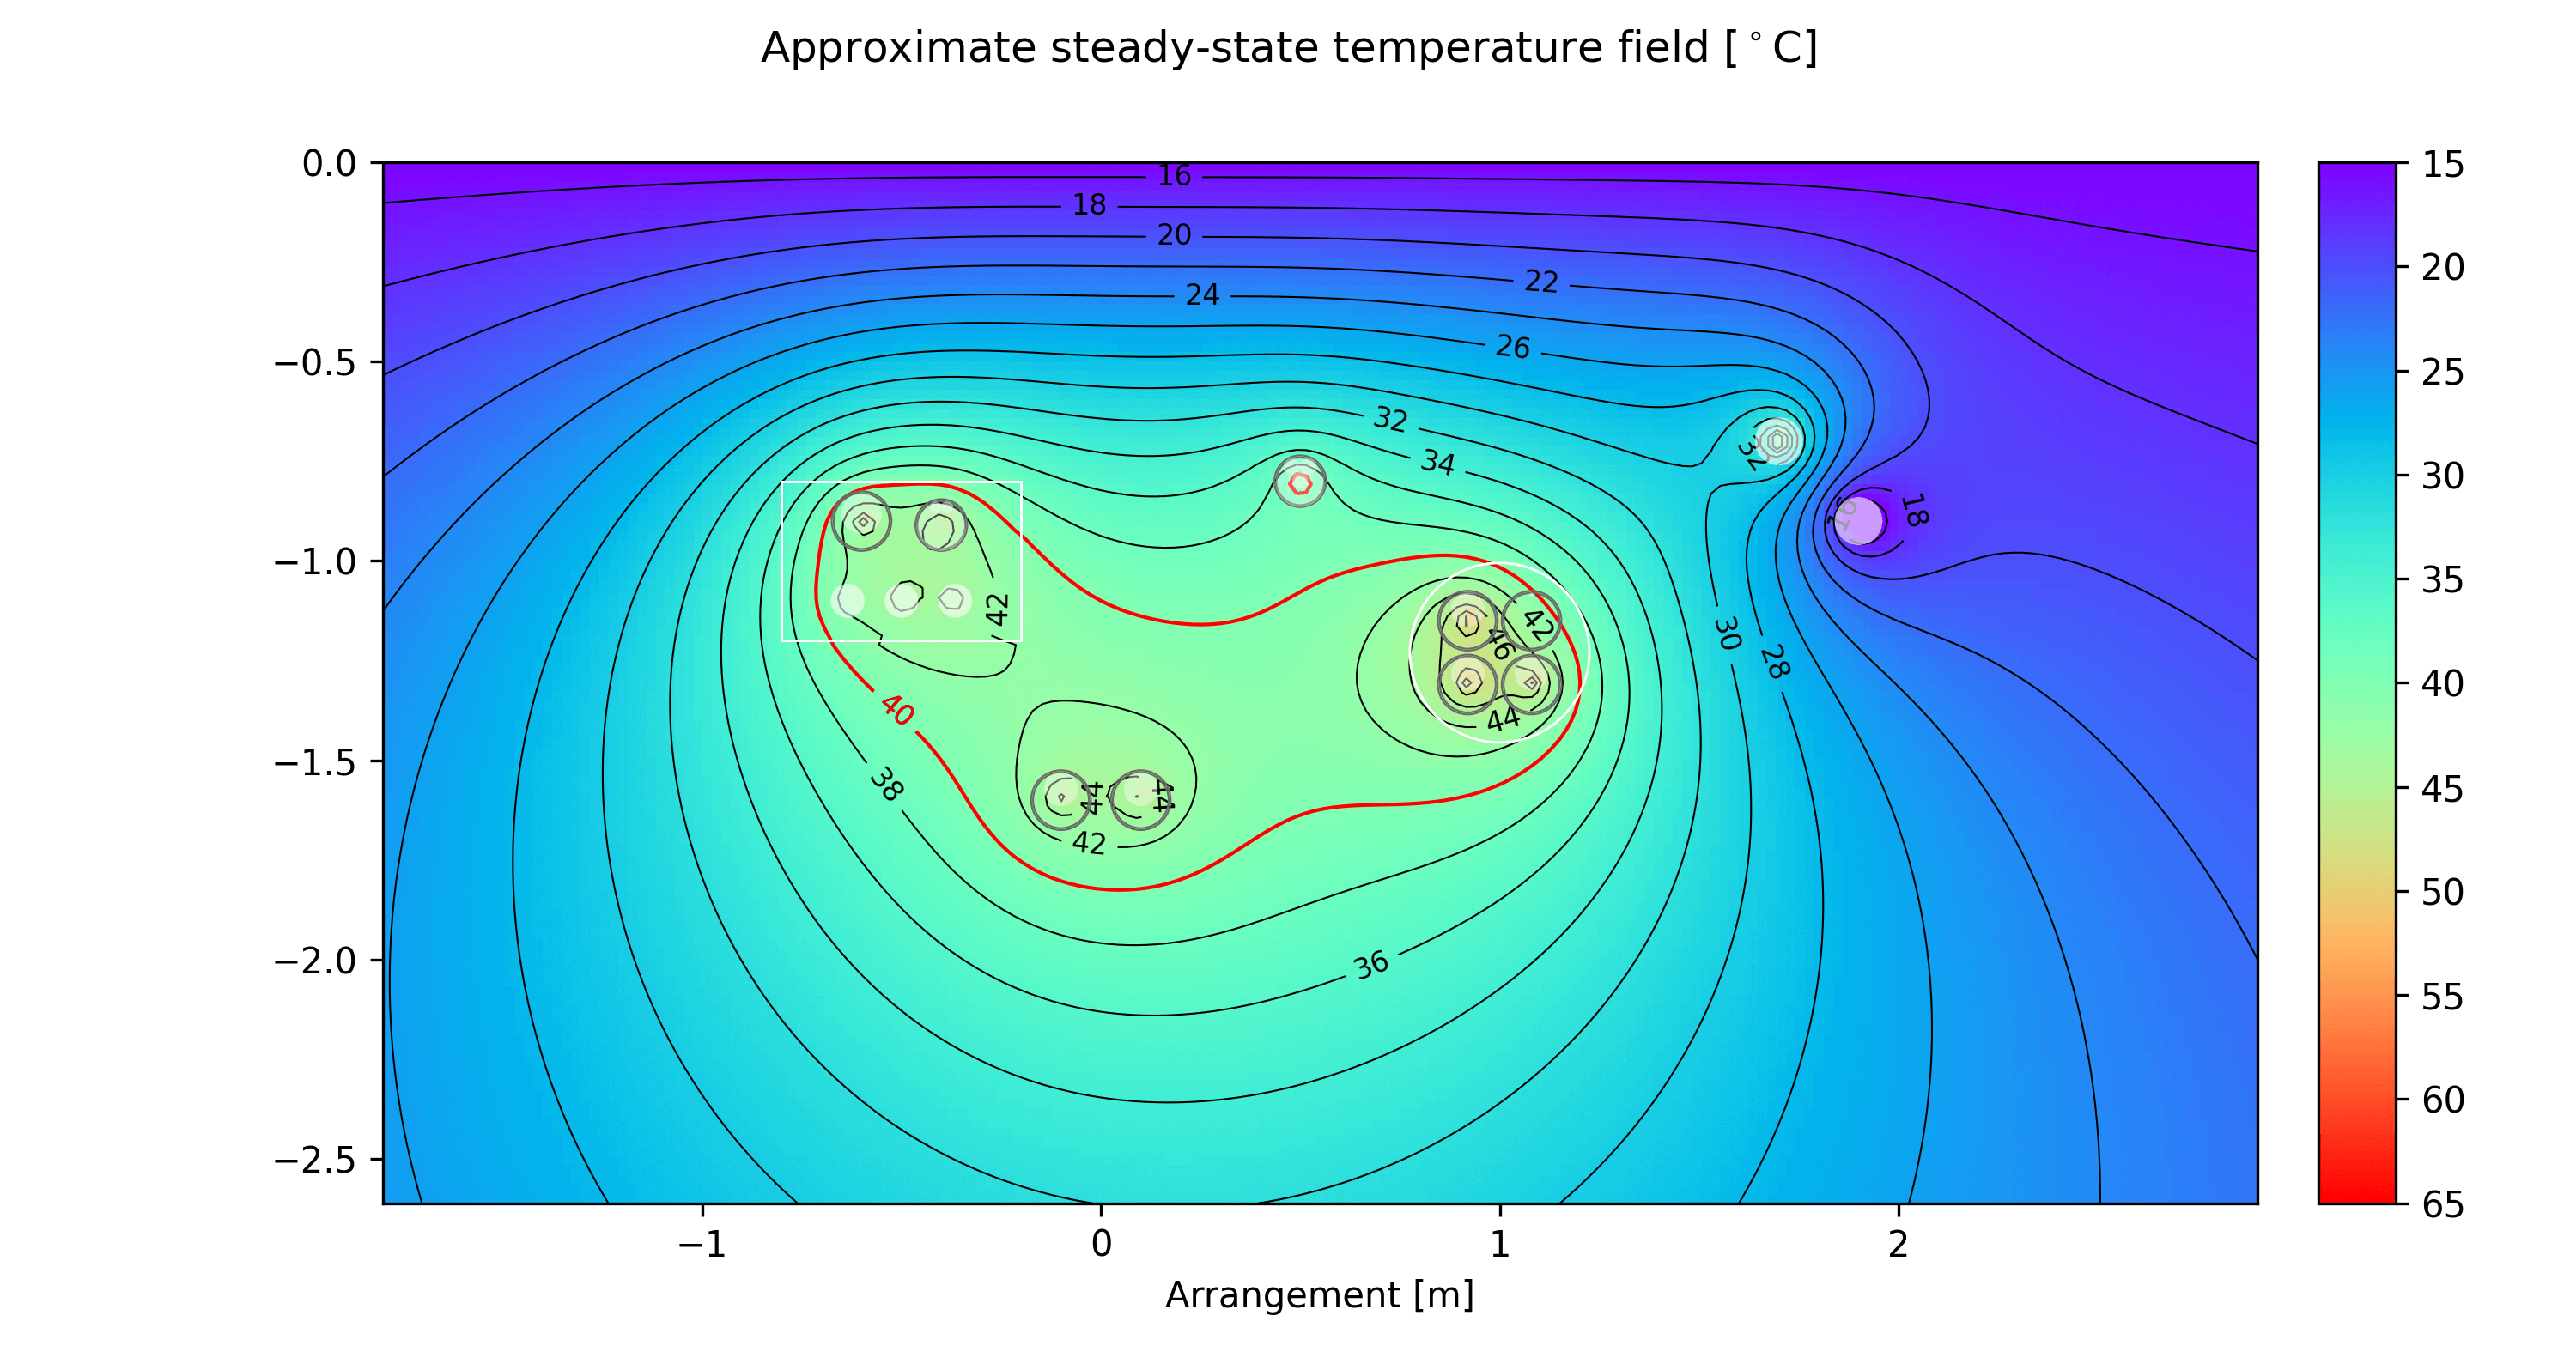 |
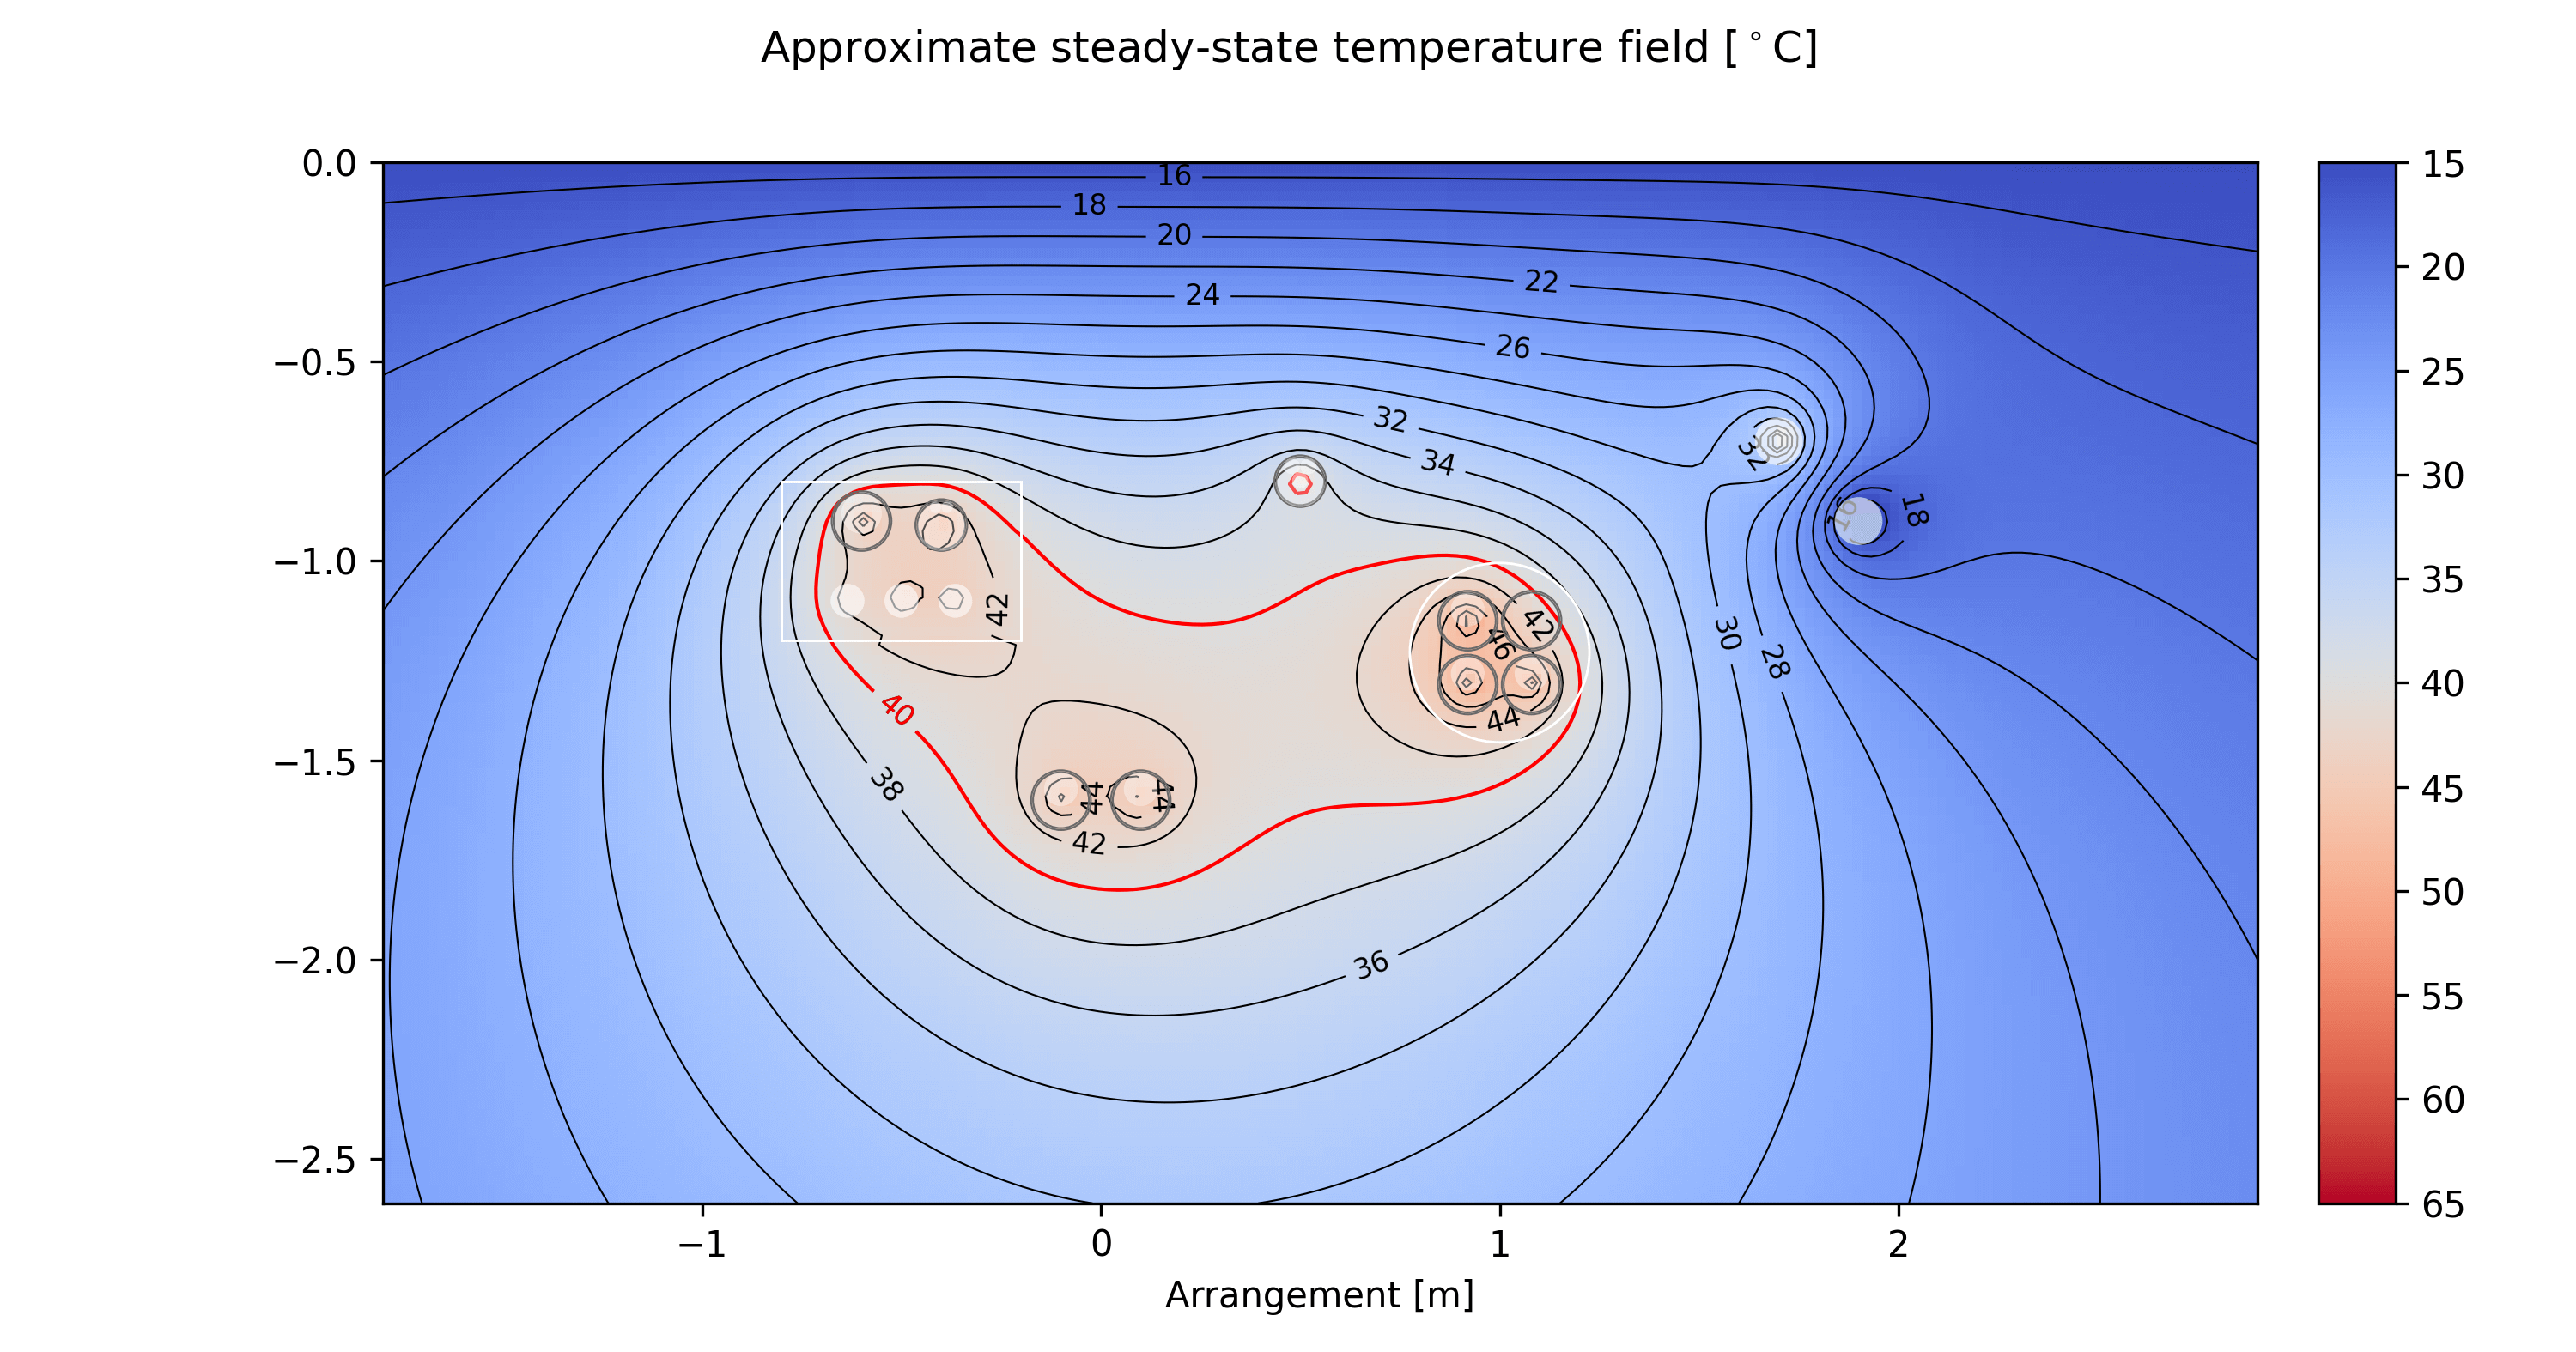 |
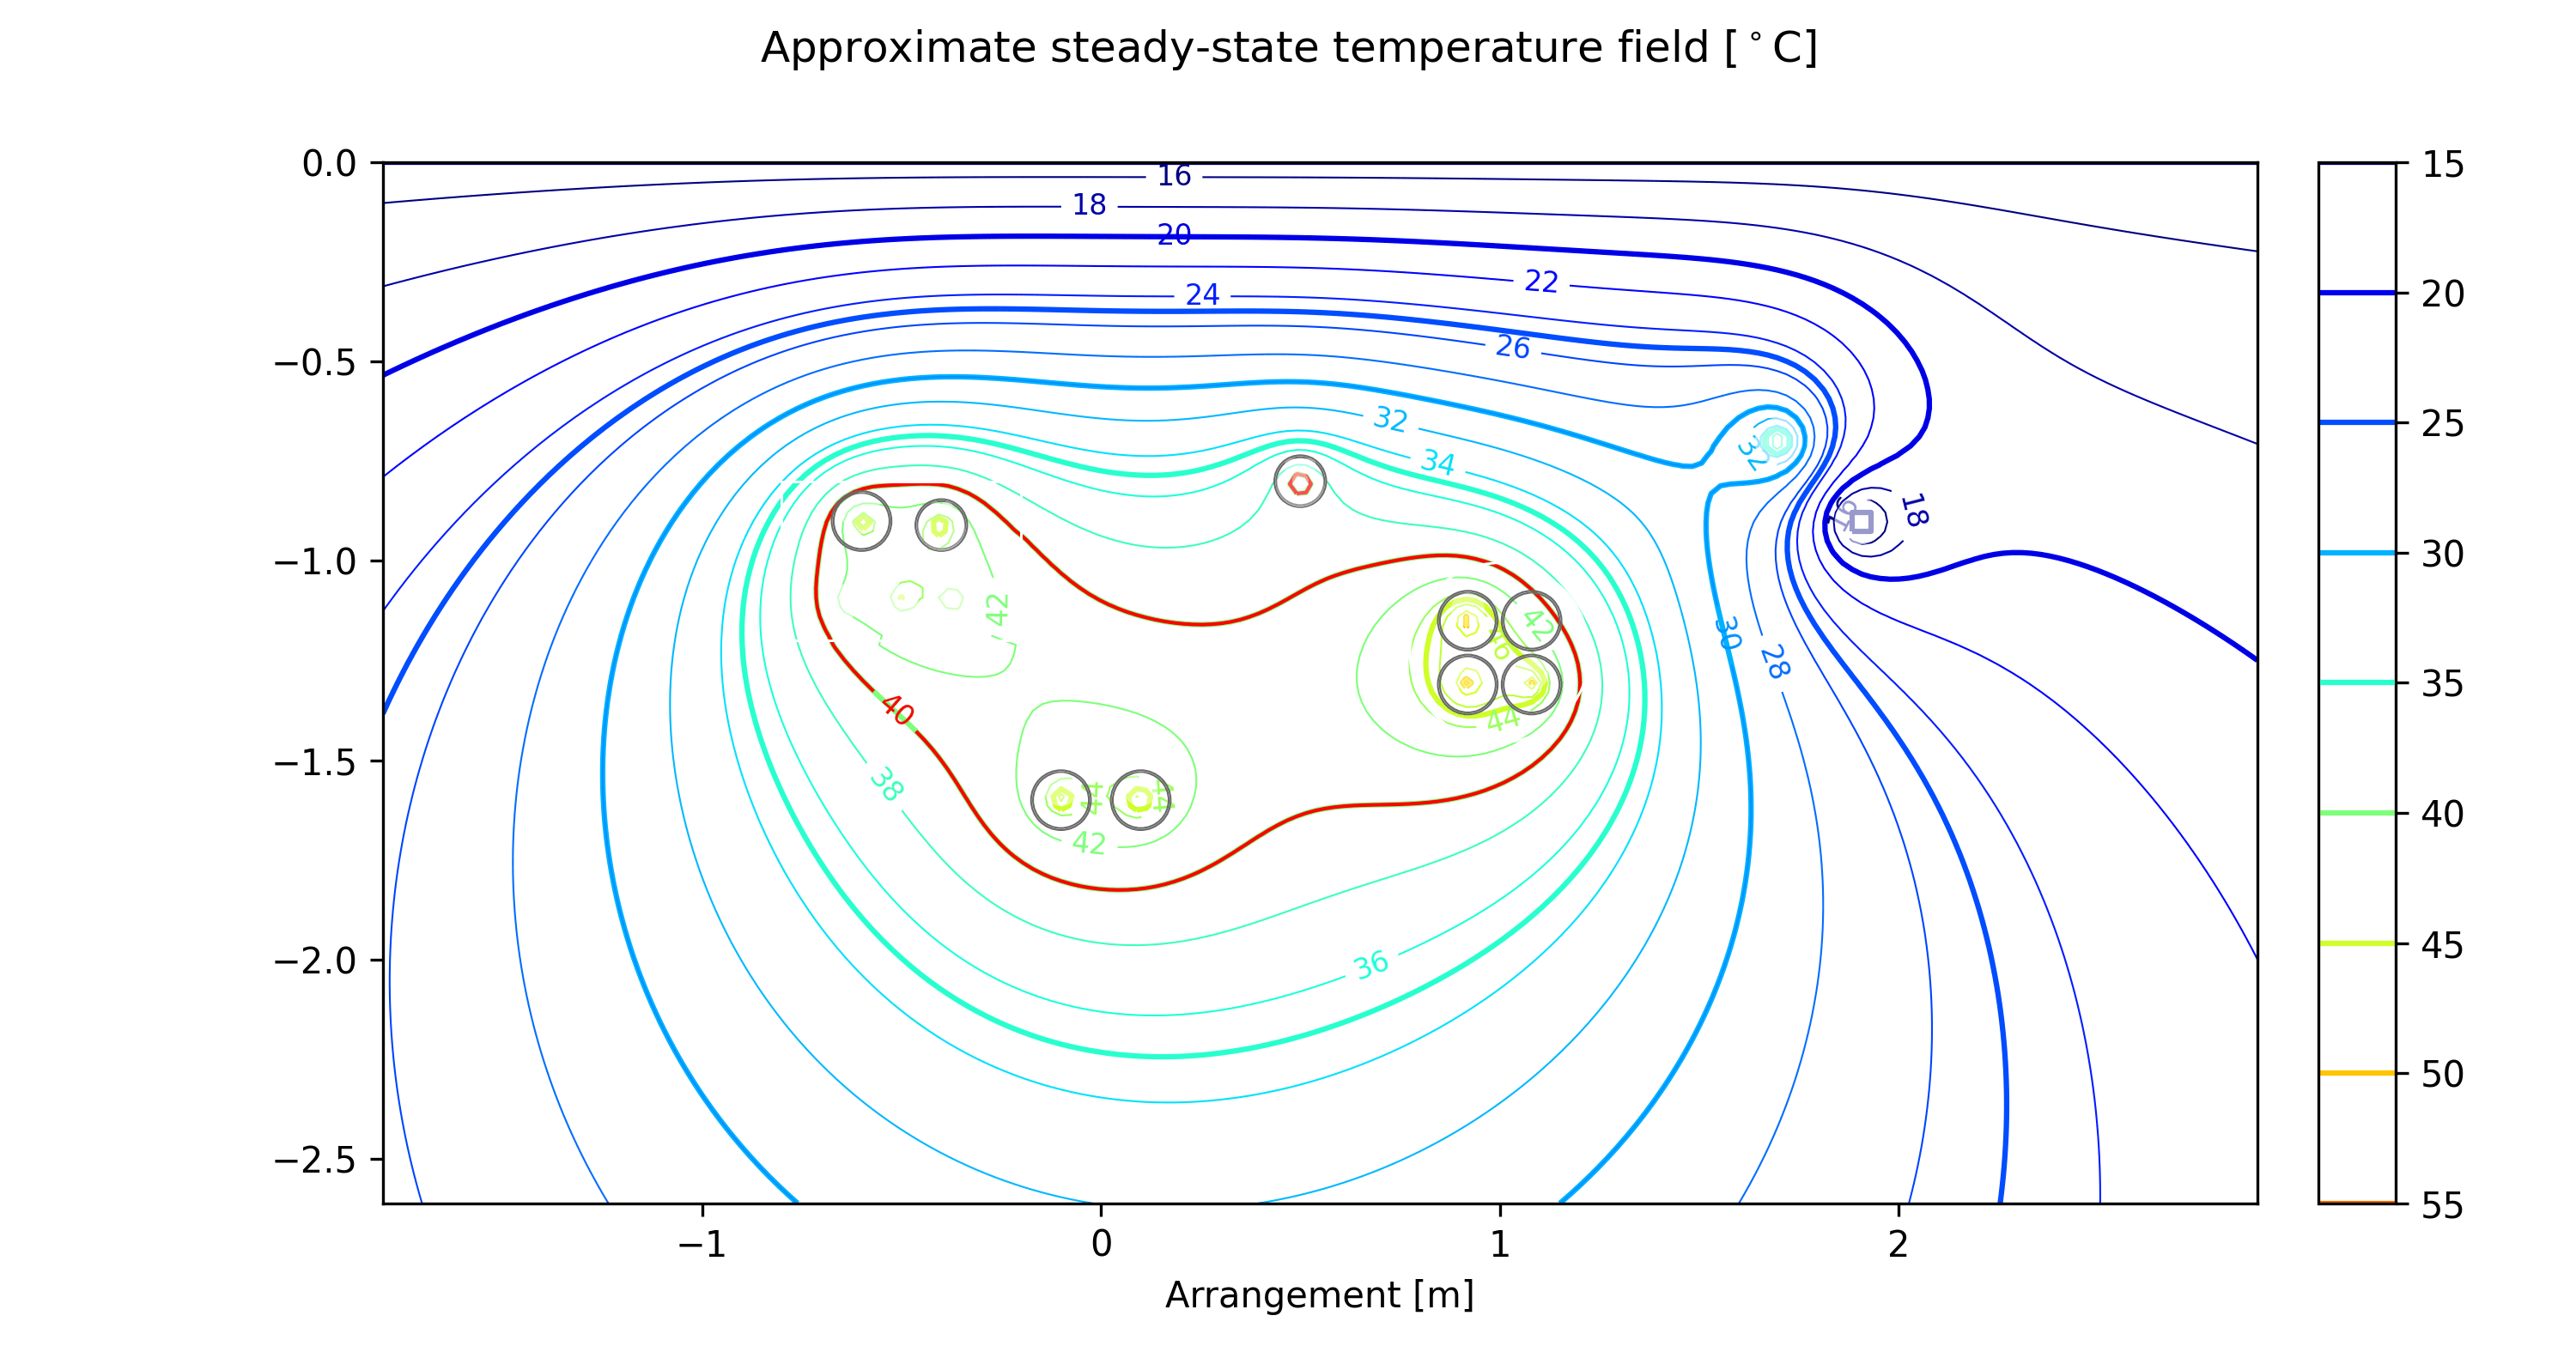 |
Following limitations apply: