With the help of Cableizer, you can prevent problems by calculating the maximum allowable pulling tension for any installation. You can easily model the cable route with sections, slopes, bends and cable pushers including a fantastic 2D and 3D preview.
Posted 2018-02-28
Categories:
New feature
, User guides
A cable damaged during installation can cause service failures. Mechanical stresses during installation are generally more severe than those encountered while in service. With the help of Cableizer, you can prevent problems by calculating the maximum allowable pulling tension for any installation.
Calculations of cable pulling should be made to indicate whether the pull looks easy or impossible, making the decision to pull an obvious choice. With Cableizer you can easily model the cable route with sections, slopes, bends and cable pushers including a fantastic 2D and 3D preview.
There are several parameters to be considered for cable pulling calculations.
| Some of these parameters are taken automatically from your cable when you load it into the cable pulling tool. The values were calculated by the cable editor where the user has the option to overwrite the value if needed. | 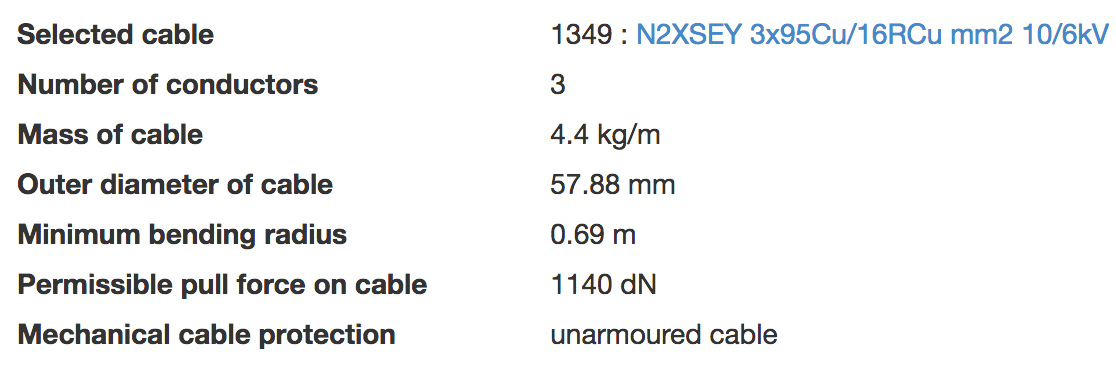 |
| Mass of cable | The cable editor automatically calculates the weight of the cables based on the exact geometric construction of all cable layers, even considering elongation due to lay of wires. The cross-section area multiplied by the specific material density equals the mass. Check out this feature in our cable editor. It even lists the mass of metallic parts (Cu, Al, Fe) in your cable. This is helpful to estimate the cable price with current LME data. |
| Outer diameter of cable | The cable editor automatically calculates the diameter based on the exact construction (constant value). |
| Minimum bending radius | Admissible values for the minimum bending radius are automatically calculated by the cable editor. The multiplier may vary for different manufacturers, therefore the user can adjust this value manually. The software checks for each bend if the radius is below the minimum bending radius and gives a warning if not. |
| Permissible pull force on cable | The maximum admissible pulling force is the product of the cross-sectional area of the stressed cable elements and the respective stress coefficient $σ$ [N/mm2]. For multicore cables, it is assumed that only ⅔ of the conductor cross-section is under load at a time. The recommended coefficients to use may vary for different standards and the user can set this value manually in the cable editor. The software checks for each section and bend along the route if the maximum value is exceeded because it is possible for the force to exceed the limit and fall below again due to a downhill section. |
| Mechanical cable protection | The maximum side-wall pressure is higher for armoured cables and even more for double-armoured cables. The tool automatically takes this information from the cable construction. The user must set the radial load limit manually in the cable pulling tool, typical values are given for reference. |
| Some parameters you set directly in the cable pulling tool. They are also applicable for the whole cable route. | 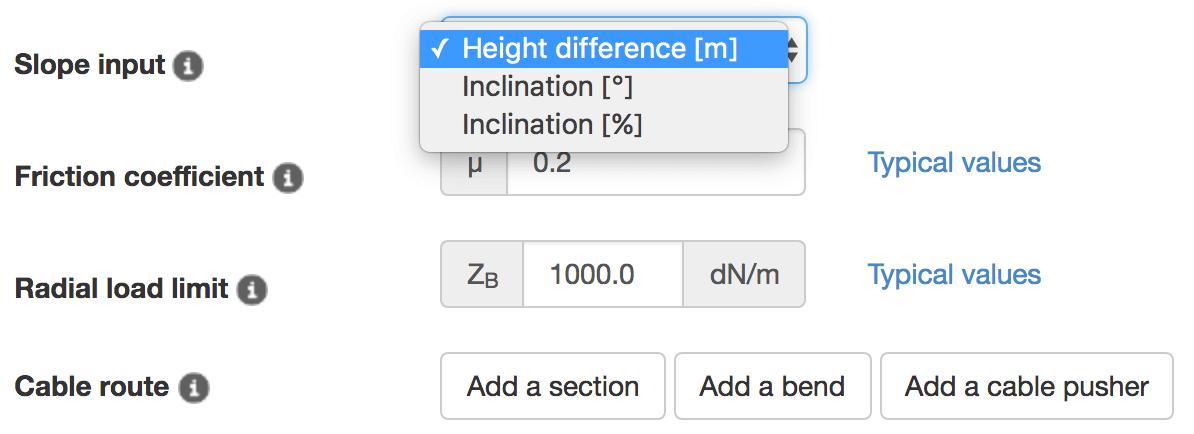 |
| Slope input | Slopes along sections are entered either as: height difference in meters (m) or inclination in degrees (°) or inclination in percent (%). |
| Friction coefficient $μ$ | The friction coefficient depends on the two materials in contact and the lubricant used. You find typical values by clicking on the link. |
| Radial load limit $Z_B$ | When pulling cables around bends, a radial force is produced, the magnitude of which is dependent on the pulling force, the radius and the angle of the bend. This is also known as side-wall pressure (SWP). You find typical values by clicking on the link. |
Having set all parameters you can start defining your cable route by adding elements: sections, bends and cable pushers.
The direction of laying is to be chosen so as to obtain the lowest pulling force at the end of the cable route. Typically, this will be the case when the cable reel is located at the end where most changes in direction occur. For sloped routes pulling should be from top to bottom whenever possible. Cableizer makes a calculation of the pulling force in both directions of your cable route. All the checks like side wall pressure are done in backwards direction likewise. | 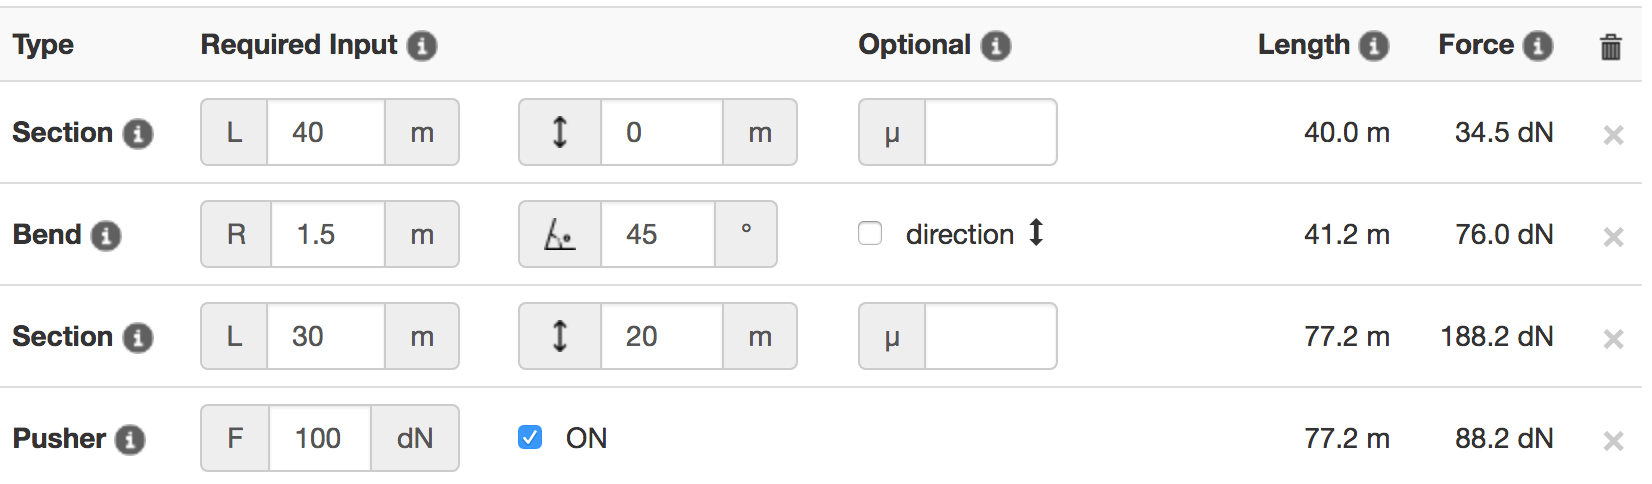 |
| Section | Sections are defined by a length (L) as seen from above on the ground (XY plane) and a slope. An individual friction coefficient can be defined for each section. |
| Bend | A bend is defined by a radius (R) and an angle between 0 and 120 degrees. Normally, the orientation is to the right (+) or left (-). The orientation may be changed to up (+) and down (-) by activating the checkbox. |
| Cable pusher | A cable pusher or cable dog is a machine used to assist in cable pulling. The pusher is defined by the force (typically between 2 to 8 dN). The checkbox must be activated for the pusher to be considered in the simulation, so for testing purposes you can deactivate it. It is advisable to use a cable pusher in front of a bend, which will reduce cable stress and allow longer cable lengths to be pulled. |
The tool makes an interactive preview in 2D using Plotly for Javascript. Plotly’s JavaScript library is free and open-source. Plotly.js is built on d3.js and webgl and runs on all modern browser and should be compatible down to IE9. As the graphs are interactive you can zoom in in order to check that the smaller bends exist. 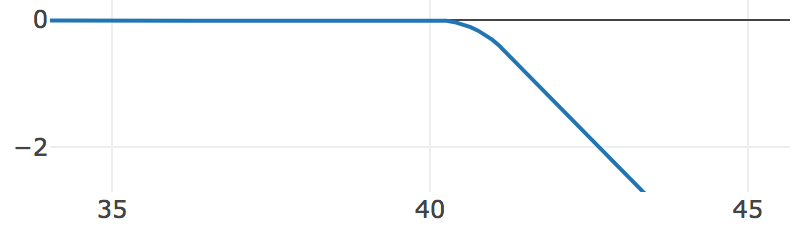 | Top View (XY plane)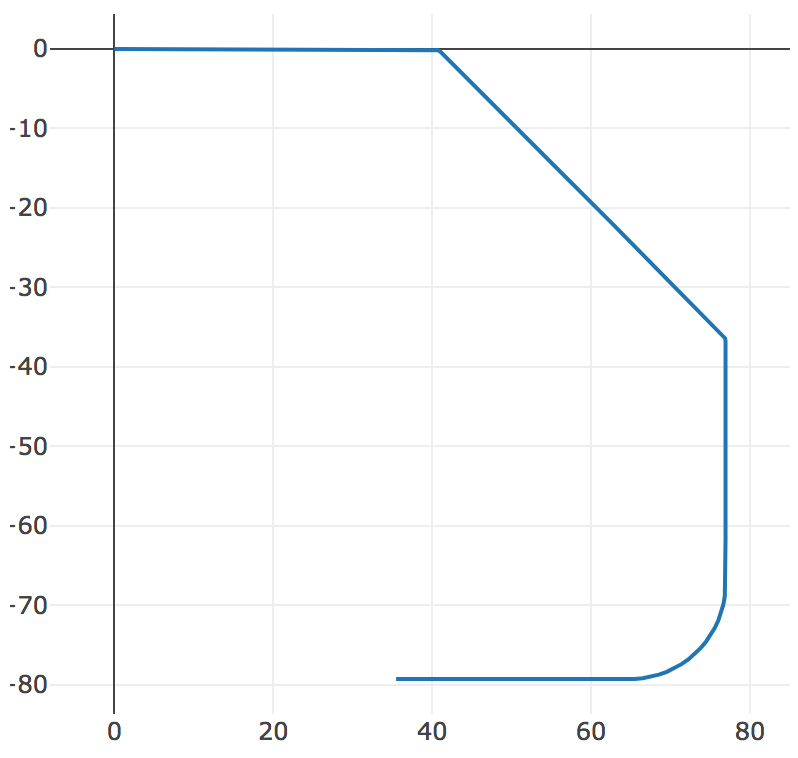 | Side View (XZ plane)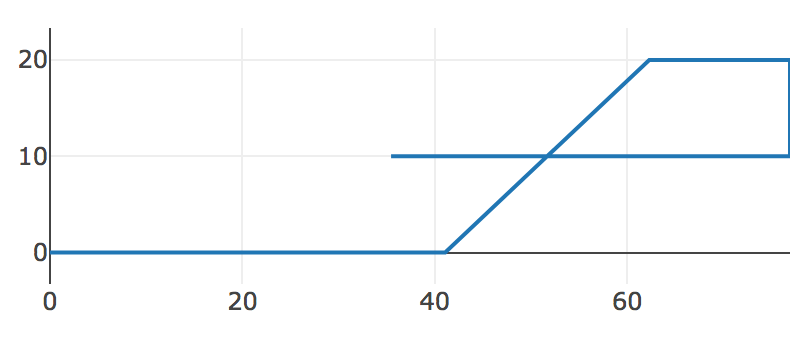 Side View (YZ plane) Side View (YZ plane)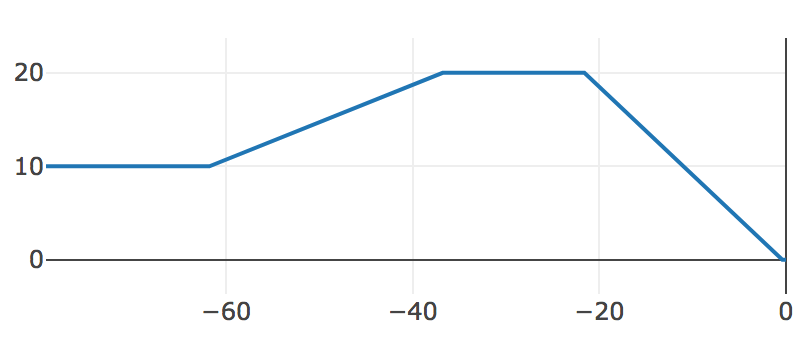 |
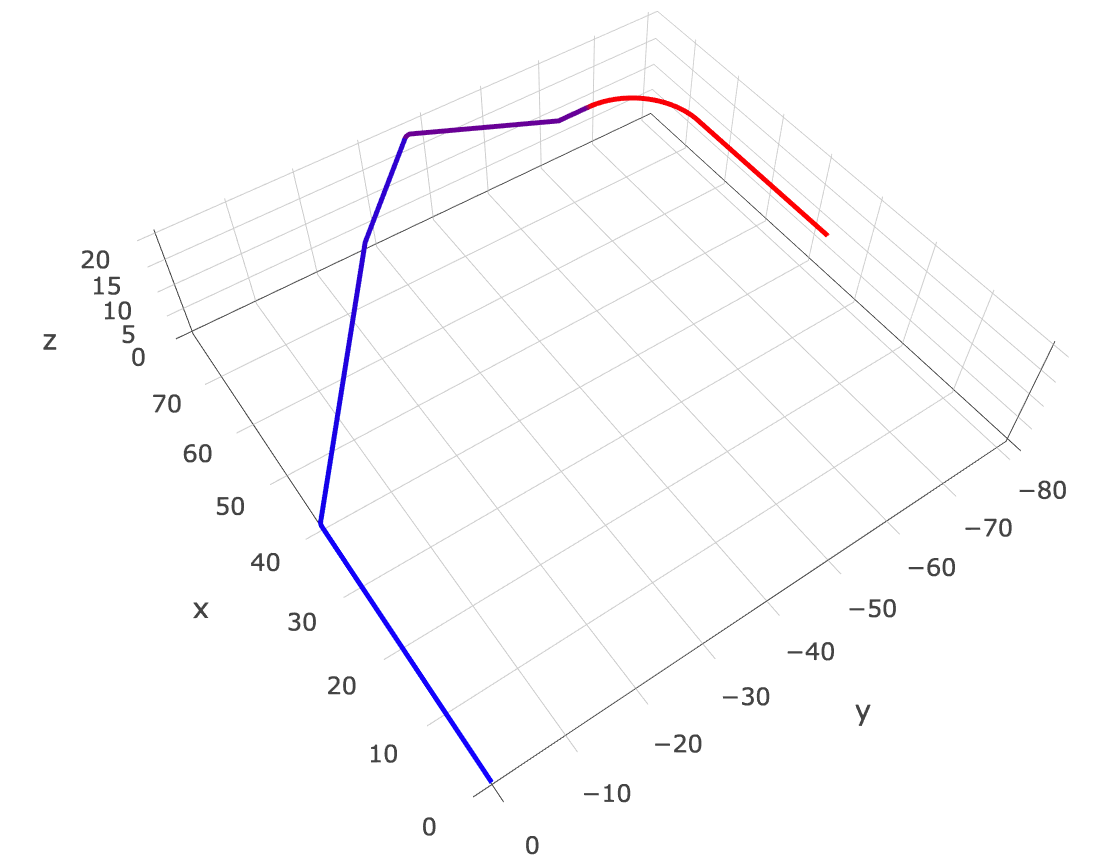
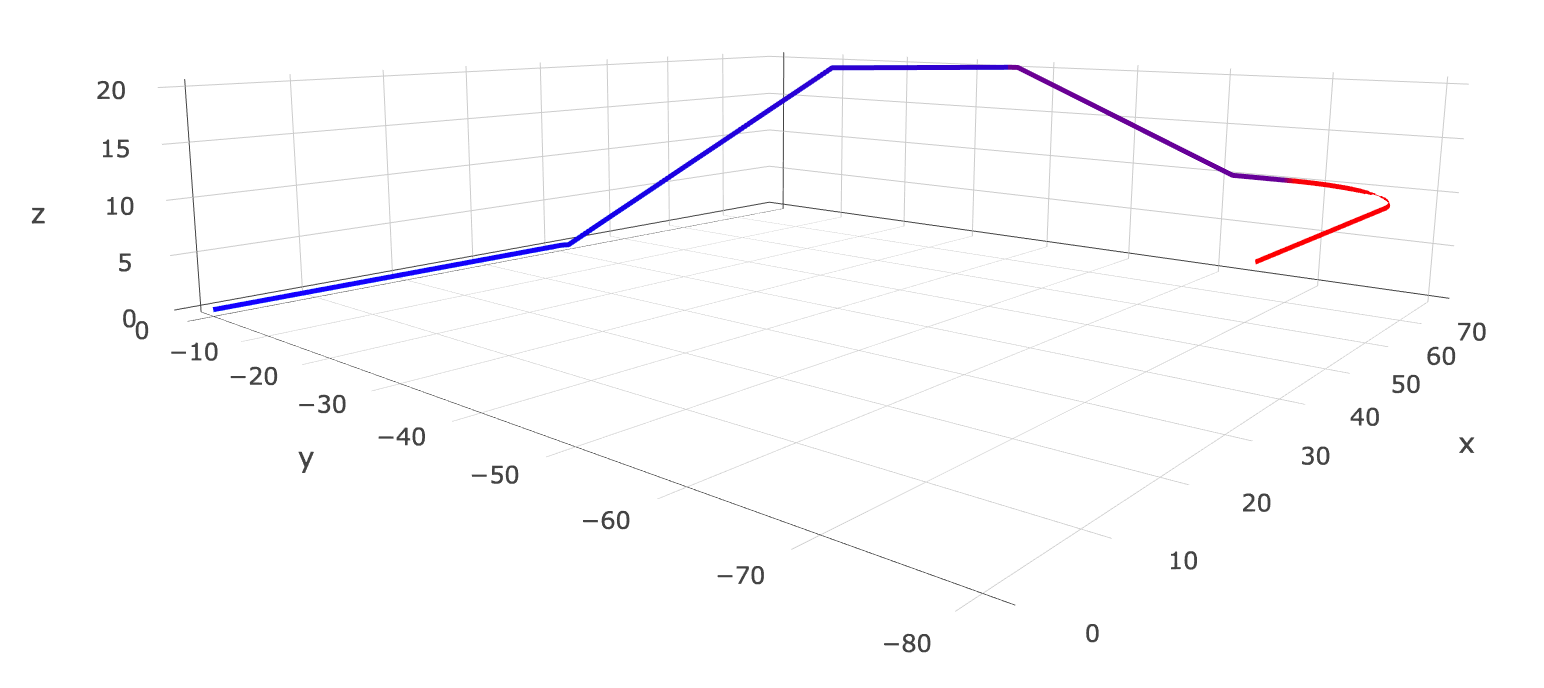
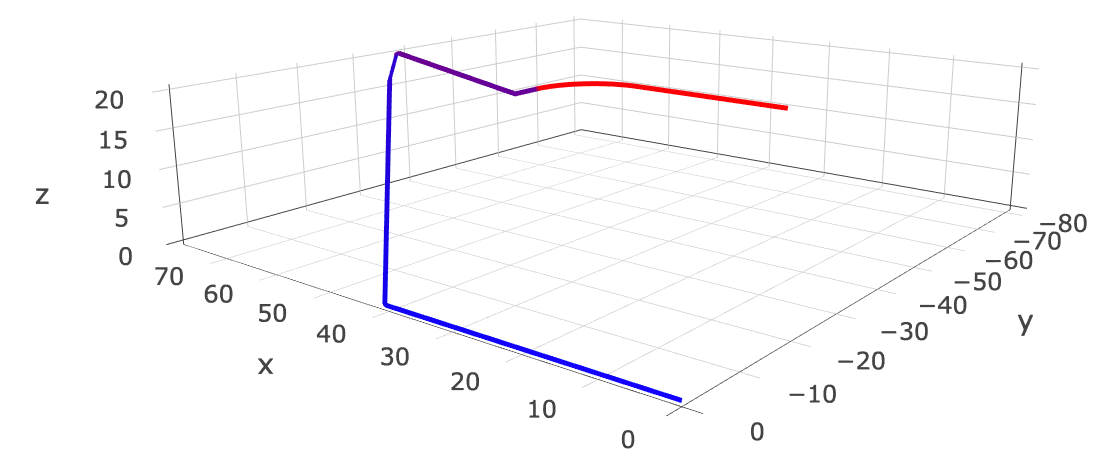
Do you agree that a preview in 2D may be helpful but can be confusing? With Cableizer you also get a fantastic interactive 3D preview. Again, you can zoom in and out but you can also turn the preview around and look at your route from all different angles to check if the modeling was done correctly.
The color of the line route is proportional to the pulling force. Low values are blue and high values are red. The pulling force usually increases along the route shown in a color gradient from blue to red. However, it may locally decrease (e.g. over a downhill slope).
 |   |
Look at this! Just cool, right?