We introduced several new features for visualization of magnetic fields.
Posted 2022-04-01
Categories:
New feature
, Plots
, User guides
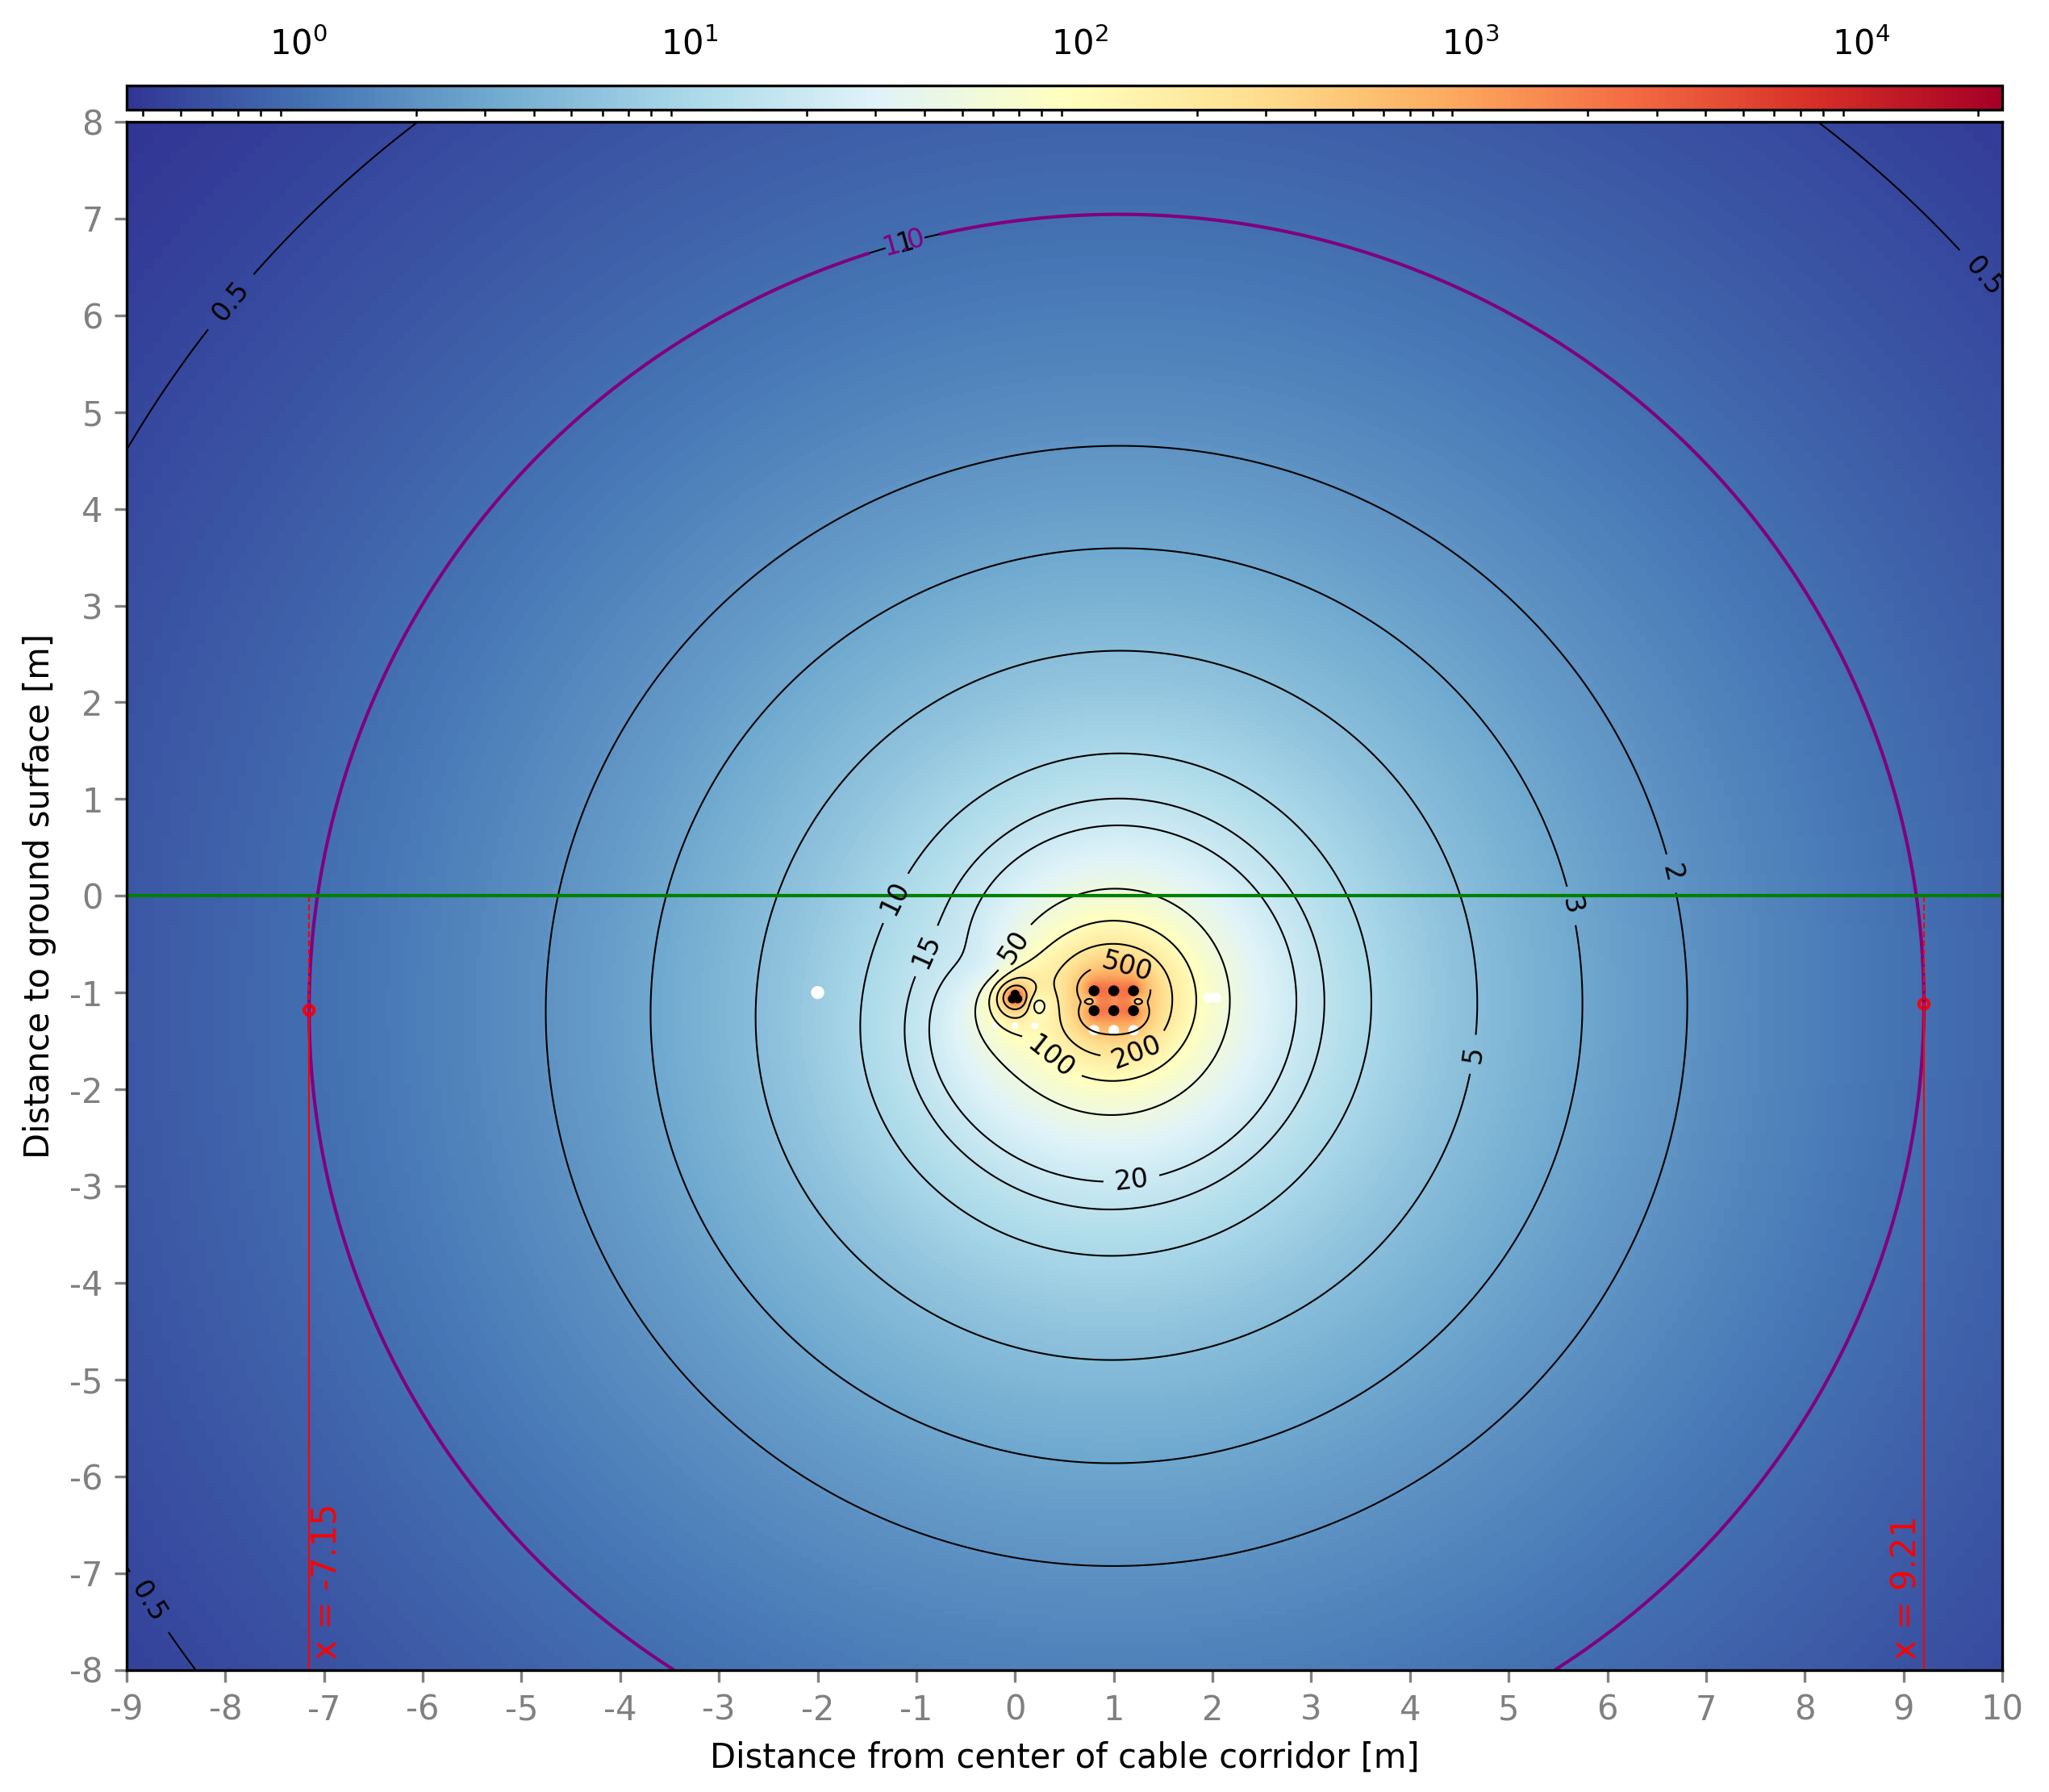
The calculation of magnetic fields (EMF) plots for buried cables has been a feature in Cableizer from early on after introduction in 2016. The output were two subplots, one in 2D and one in 1D. The 2D plot shows a colormesh with isolines of the magnetic flux density calculated at any point around the cable installation and the 1D plot shows the magnetic flux density at various heights above ground. The calculation had to be done after the ampacity calculation with the given phase arrangements and current values. It was possible to set a specific phase shift between the systems, something which is only relevant for installations with different frequencies such as 50 Hz 3-phase systems and 16.7 Hz 2-phase railway systems used by some European railways.
In 2020 and 2021, we introduced step-by-step EMF plots as well for cables subsea, in tunnels, in troughs and in risers (considering cable going straight up). All these produced only a 2D plot. In addition, we introduced the possibility to include the EMF plot into the ampacity reports. The phase shifting setting was moved from the project editor to the ampacity result modal in order to simplify the setting in the editor and allow for more flexibility when testing phase shifting effects. Last but not least, end of 2021, the resolution of the EMF plot was increased a lot to allow for better usability of the downloaded png image.
With the new version from March 2022, many new features for visualization of magnetic fields (EMF) have been introduced which do increase the usability and improve the user experience.
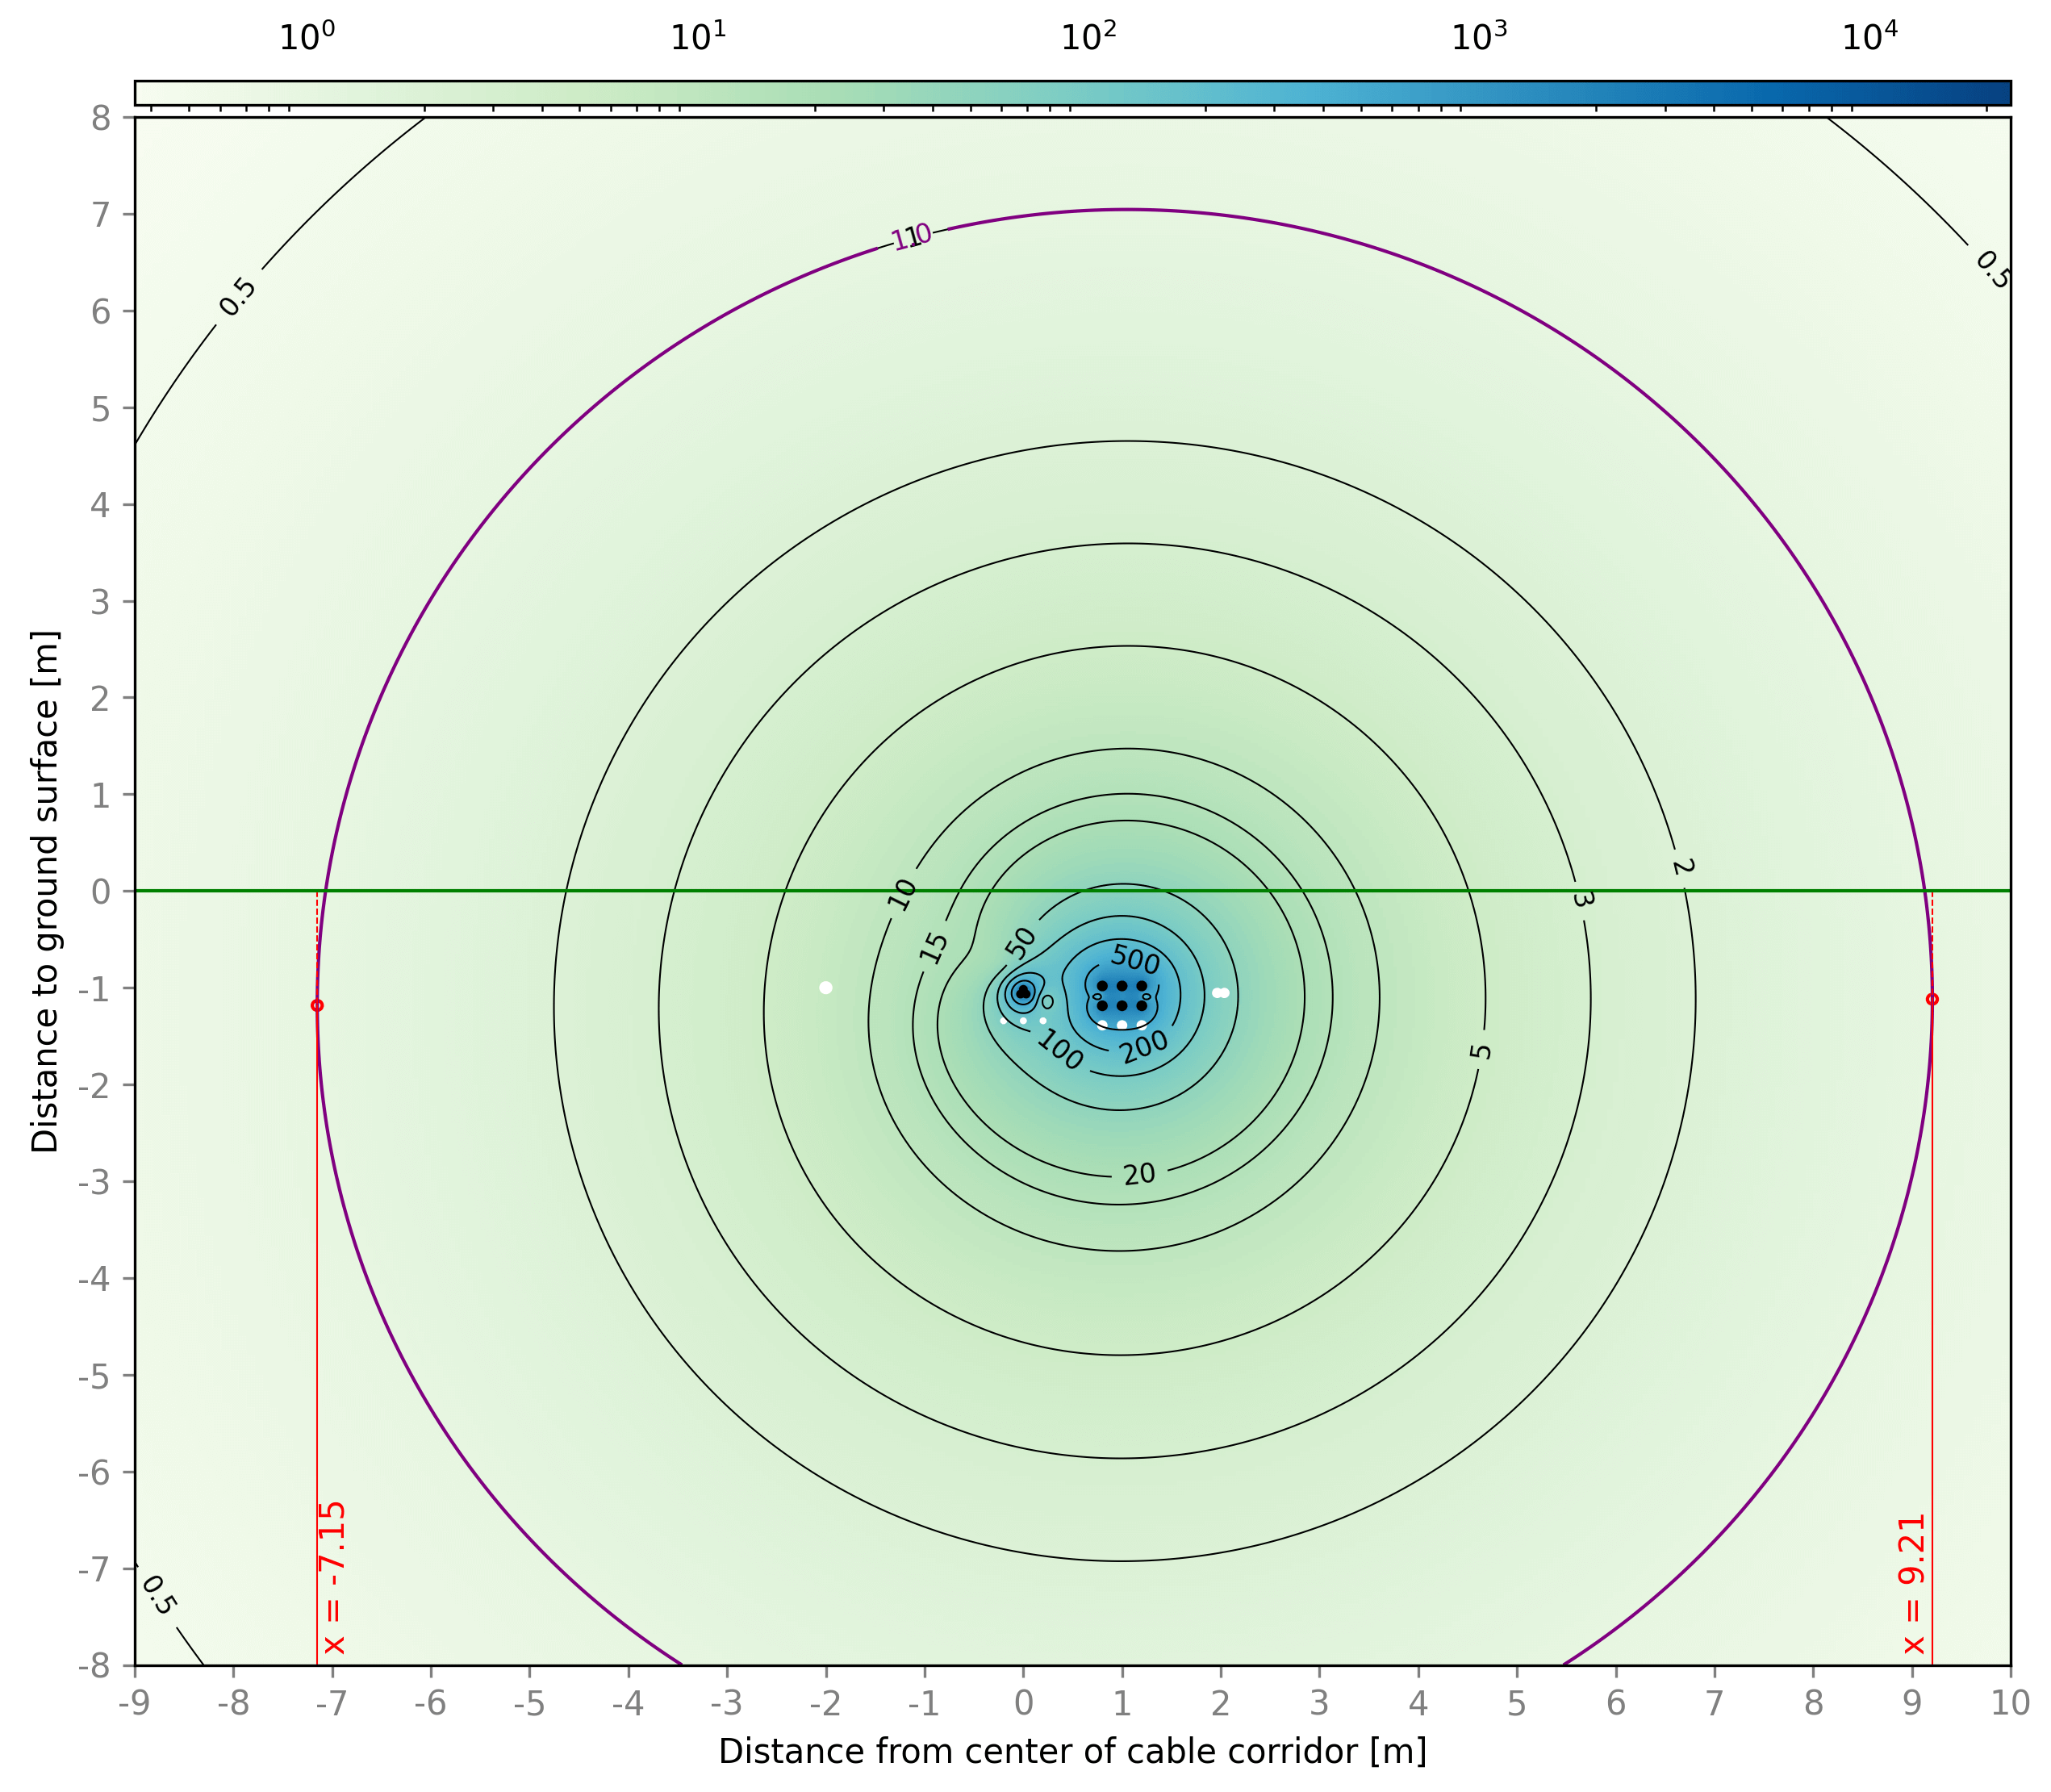
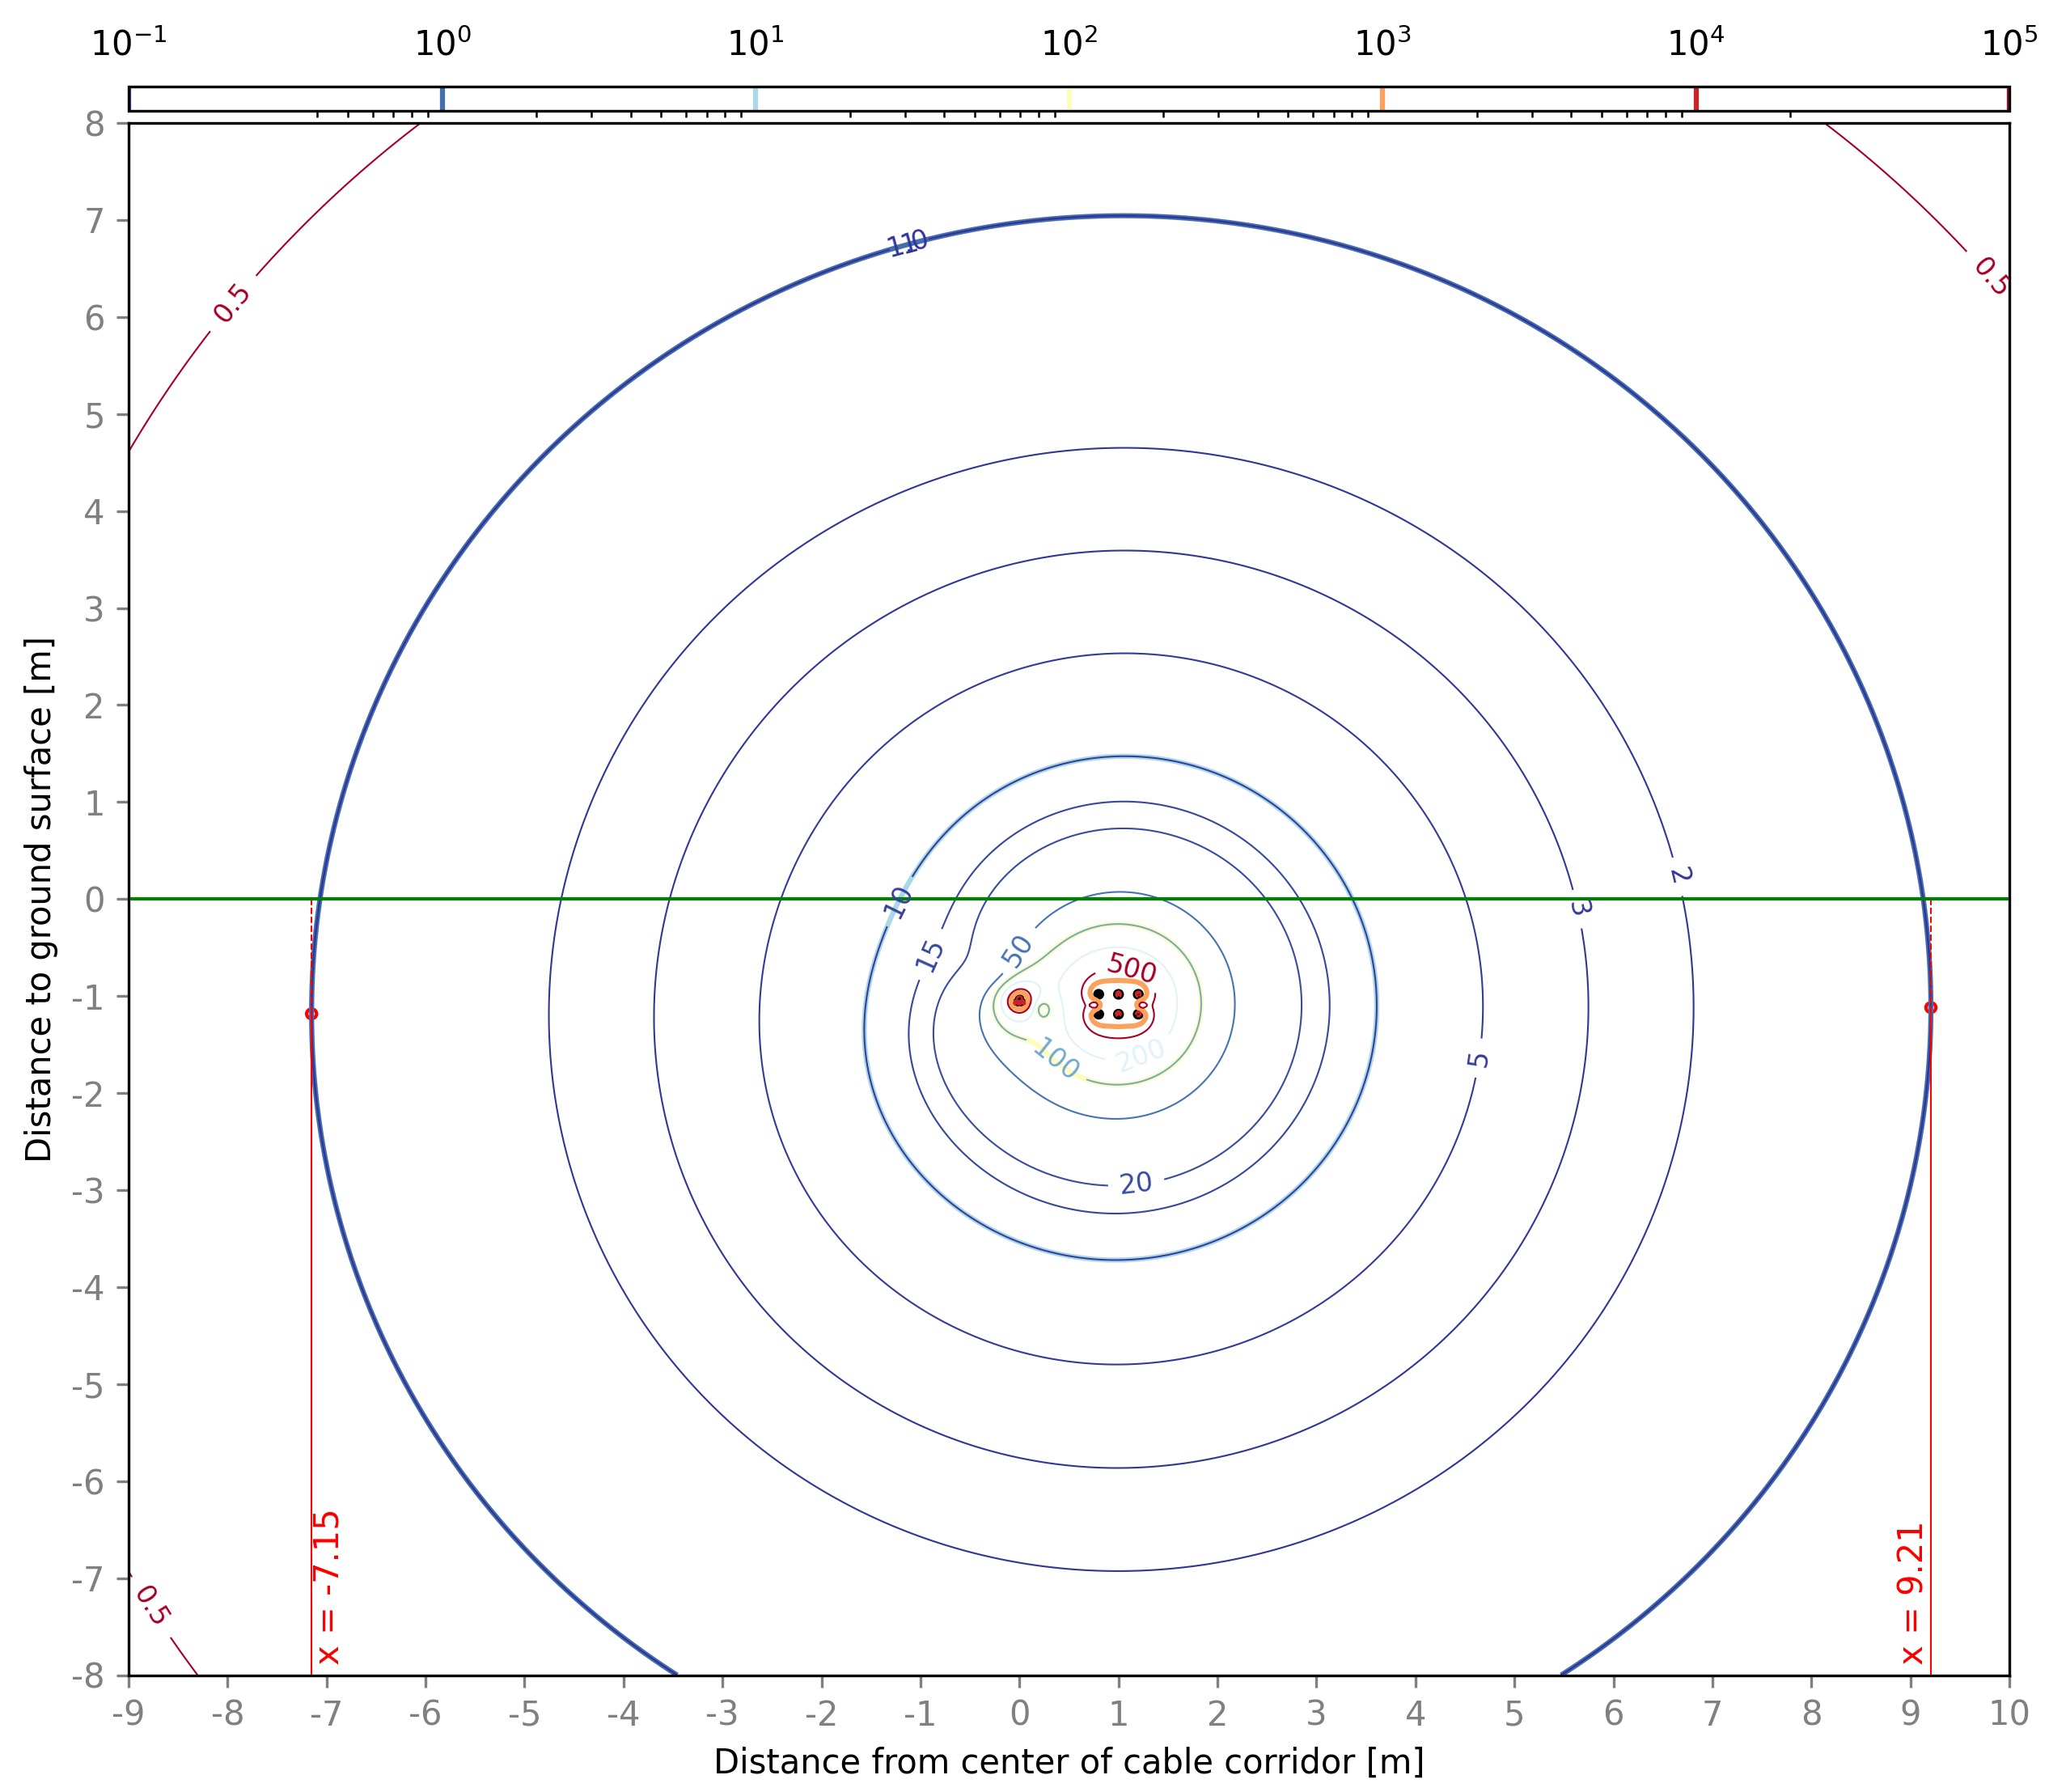
| EMF in 2D, colormap RdYlBu_r | EMF in 2D, colormap GnBu | EMF in 2D, colored isolines |
|---|---|---|
 |
 |
 |
Following limitations apply:
We plan to introduce further improvements for EMF. Our most challenging goal is the implementation of an optimization routine for the phase arrangement which has now to be set in the project editor before starting the ampacity calculation.