The solar radiation calculator is a tool that estimates the intensity of solar radiation for a given day and a given place depending on its location and altitude.
Posted 2018-06-09
Categories:
Theory
, Tools
The algorithms used for the calculation of the solar radiation are based on the publication "Procedure to Compute the Intensity of Solar Radiation for Cables in Air" by Francisco de León, published in 2004.
The model described by de Léon is based on one of the most commonly used clear day models. It is presented by the American Society of Heating, Refrigerating, and Air Conditioning Engineers (ASHRAE) and is based on empirical data collected by Threlkeld and Jordan. The method is called the ASHRAE clear day solar flux model and the calculations assume clear weather conditions and assume that the location is not shaded.
We offer the solar radiation calculator for free!
Also have a look at our free Soil Temperature Calculator.
As an example, we show the solar radiation at the location of the Cableizer head office in Switzerland on the day of this publication, 9th of June, 2018.
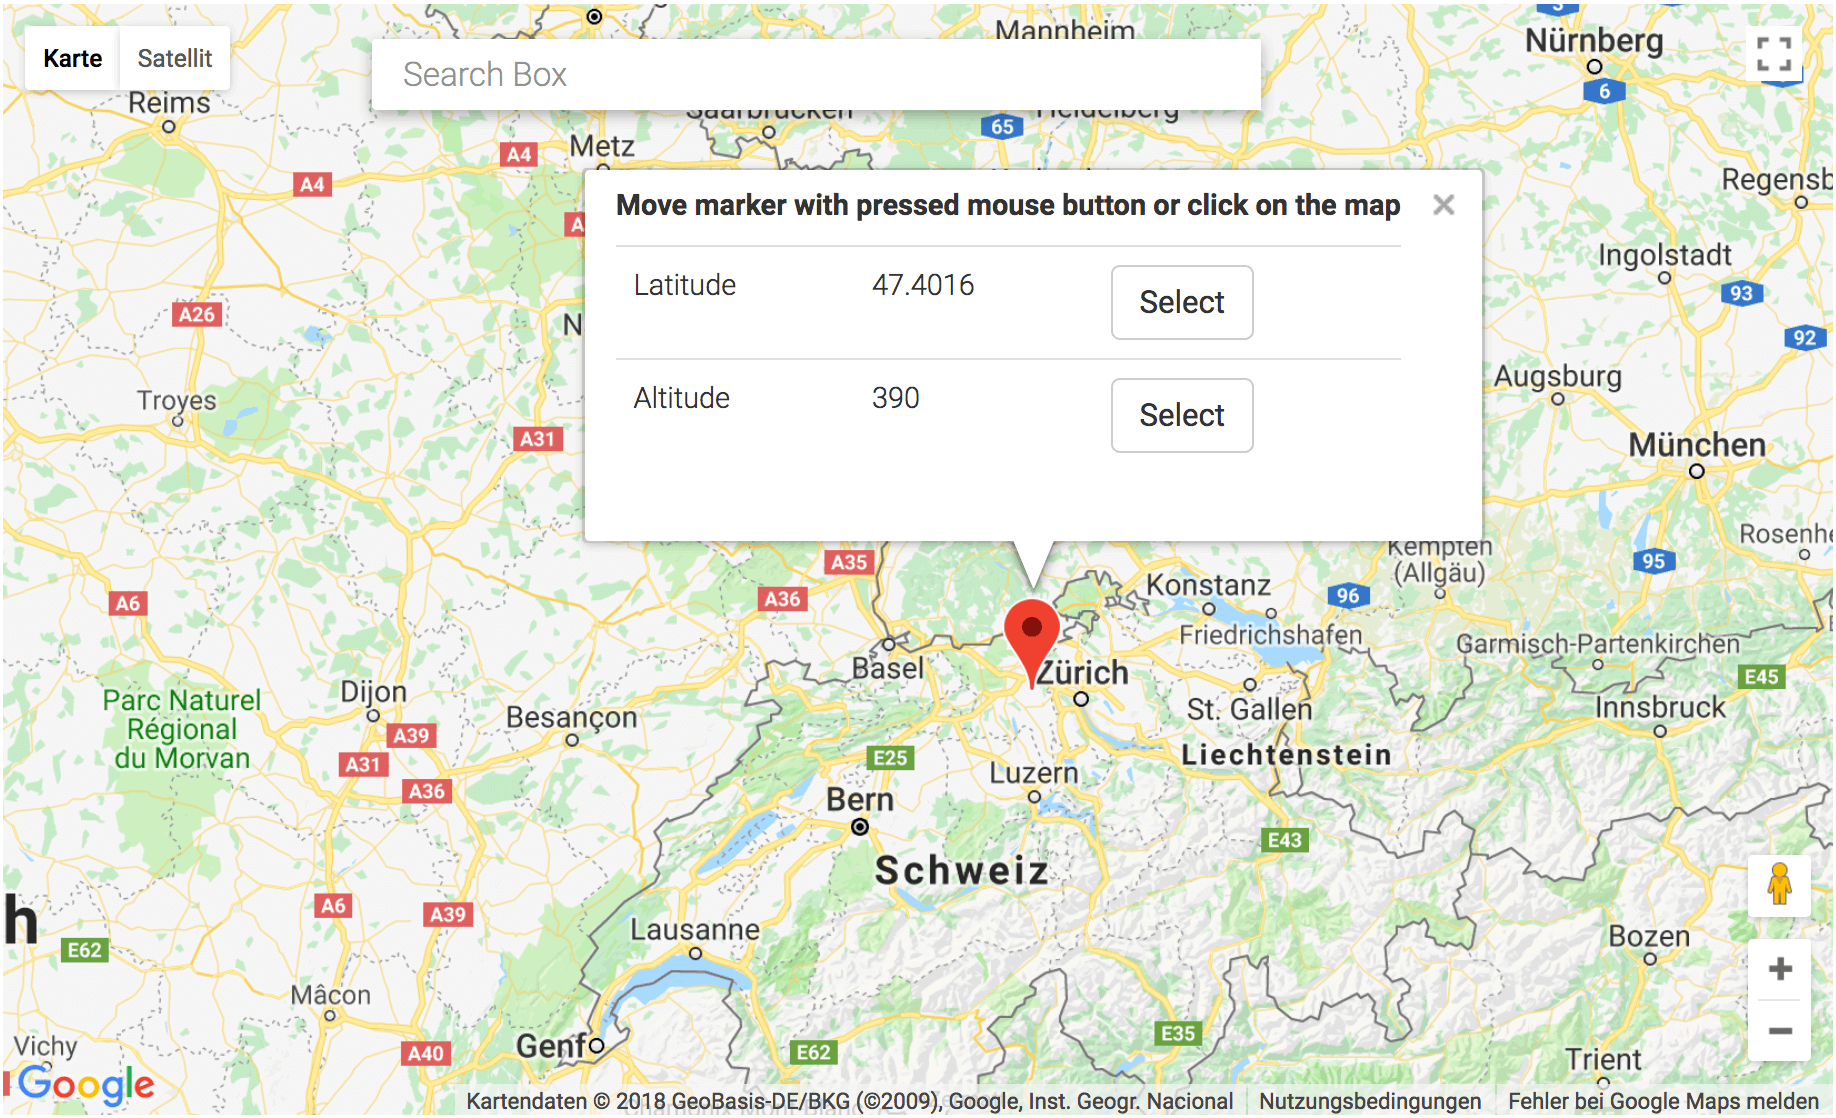
First we need the latitude and altitude of the location. For this, you can use our Google Maps interface. Simply move to the desired location and then click on the "Select" buttons. In this example, latitude is 47.4016 and altitude is 390 m above sea level.
 |
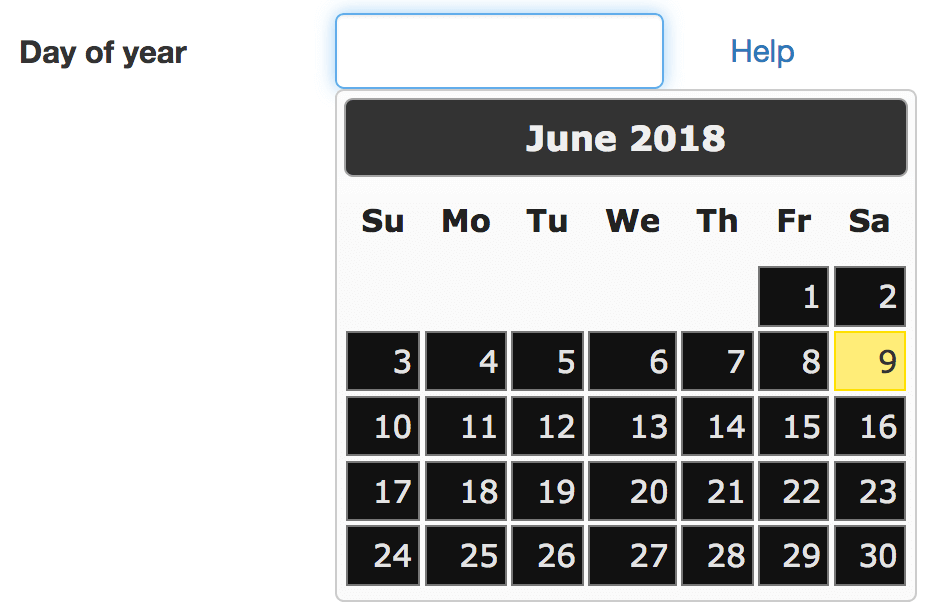
Now we need the day of the year. For this, just click on the calender icon and select the date you like. In this example, it's June 9, 2018 which is the 160th day of the year.
| 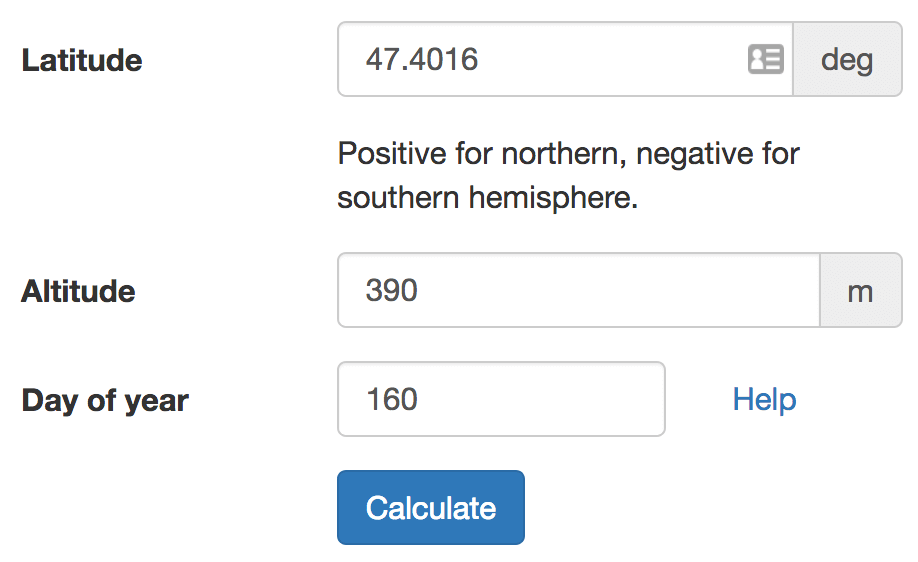 |
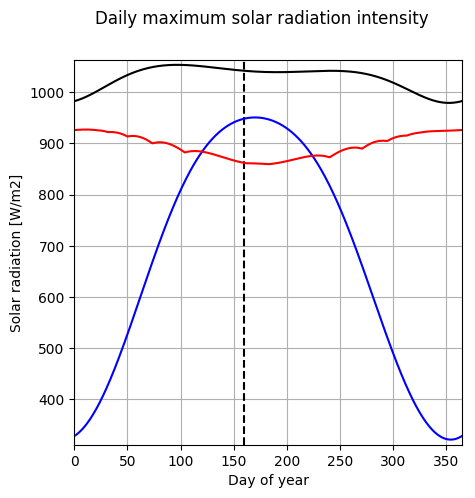
Now we are ready to click on the "Calculate" button. The result will give us the maximum solar radiation at day 160 which is 1041 W/m2. This value can be used in the project editor by the click of a button.
 |
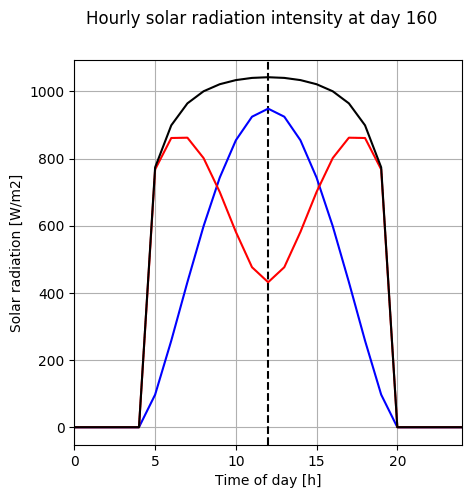
However, you may want to have a more thorough look at the solar radiation at your chosen location. So the following figures show you the solar radiation over the 24 hours of your chosen day plus in a second graph the solar radiation over the year.
There is even more: The graphs show three colors meaning the solar radiation intesity on a horizontal surface (blue), on a vertical surface (red), and on a surface perpendicular to the sunlight (black).
 |
 |
However, due to the great number of cloudy days per year, the results obtained by these models do not truly represent reality. This is even true when the models are sophisticated and use methods to solve the radiative transfer problem.
According to Mikulovic2015, another group of models uses procedures for estimating the average insolation that can be expected under real conditions at a particular site. These models usually use long-term measurements of solar radiation hitting a horizontal surface. A set of equations is then used to estimate the insolation on inclined surfaces, such as photovoltaic (PV) panels. And there are simple cloudy sky models that need meteorological data of the total cloud amount.
A clear day model will give the maximal possible value wheras other models try to give more the average value. If one is calculating the potential of a PV power plant, cloudy sky models are of essence. But in case of cable rating, we have to respect the worst-case scenario, which means the highest possible solar radiation value is needed and the clear sky model is well suited.
You may want to look at some further literature in this field: